Scaling Kubernetes Without the Pain of etcd Sharding

Aug 2, 2025
|
6
min Read
.png)
Editor's note (August 2026): The demo and performance comparisons in this article focus on shared node virtual clusters, the control-plane isolation model where tenant workloads share the underlying worker nodes. While this remains the right model for the etcd bottleneck problem this article addresses, vCluster’s capabilities now extend beyond shared nodes. Since publication, vCluster has also introduced Private Nodes as the production default for large enterprises and AI cloud providers managing AI infrastructure at scale. For more information, see our updated docs.
Kubernetes natively uses etcd as its underlying data store, storing object state. Apart from the objects for state, the operations (including state management and reconciliation loops) need to reference the key-value store for a single source of truth.
Since etcd is the store used across a cluster of machines, it handles all operations necessary to maintain the cluster in a healthy state. From maintaining state to updating CRUD transactions and state changes over time, these operations generate load on both the API Server and the data store. With many teams and operations relying on a single etcd, teams often overlook the long-term implications of etcd usage as they scale.
In this blog, you will explore practical sharding strategies available when using virtual clusters to reduce the load on your etcd and Kubernetes api server using a real-world demo so you are prepared as your team scales.
etcd is a critical dependency for the Kubernetes control plane, and many cluster crashes are caused by increased average latency. When the recommended maximum of 8GB (the default is 2GB) for etcd is exceeded, there is a high risk of etcd instability and degraded operations due to higher latency.
All of these factors highlight the importance of understanding how etcd usage directly impacts both the stability and performance of your growing Kubernetes clusters. Besides the etcd bottleneck, there are many scenarios where your API server is also a bottleneck.

example, OpenAI (API, ChatGPT & Sora) experienced an outage in 2024 due to unintended load from a telemetry service on executing resource intensive Kubernetes API operations, whose cost scaled with the size of the cluster and brought everything down.
This incident speaks to how control plane and etcd bottlenecks become more common as organizations and workloads scale. The most common strategy is to scale with HA, but if not architected correctly, there’s a risk of taking down all of your systems at once.
Every object state, configuration, and operation ultimately interacts with etcd through the API server, making both essential for cluster stability and scalability. Understanding the bottlenecks is a first step in improving performance and scalability. The first bottleneck is the database size, which we already discussed, but there are a few more interrelated bottlenecks:
etcd’s storage engine (BoltDB) and Raft replication algorithm both have limits on how quickly they can serialize, store, and synchronize data as the object count increases. Significant delays occur when etcd approaches around 30,000 to 40,000 objects (such as pods, secrets, and other objects ). These delays result in API server slowdowns, longer pod start times, and timeouts. At higher object counts (for example, around 80,000 pods), which is very common in multi-tenant environments, etcd can become severely overloaded, leading to lost cluster operations and member failures.
That's why keeping the etcd database size under 8GB and limiting the number of objects per type (e.g., less than 800MB per resource type) helps prevent cascading performance issues. However, enforcing this is unsustainable for most use cases as your architecture doesn’t scale with you.
All teams and tenants share a single etcd cluster; write or read heavy CRDs, or poorly managed controllers create excessive load on etcd through frequent state changes or large resource footprints.
The "noisy neighbor" problem occurs when one team’s aggressive resource use, such as high-volume Custom Resource Definitions (CRDs) or events, stresses etcd and affects performance for unrelated workloads. The only solution is strong multitenancy (separating clusters per team), which is very costly due to control plane expenses. Maintaining and networking across your environments can also add operational complexity, even if you’re using a networking plane like Istio.
Simply increasing object count within a single Kubernetes cluster (pods, nodes, CRDs) quickly pushes etcd and the API server toward fundamental limits. As data size, object count, and concurrent client operations grow, storage and network bottlenecks develop leading to exponential increases in latency. Sometimes it occurs across different teams within a shared cluster, or it’s just CRD spam from one team to all other tenants.
Eventually, object churn and state reconciliation loops become unmanageable, further increasing the load. Cluster federation or hierarchical management platforms can help, but their setup requires significant effort. Another approach is to regularly compact and defragment the etcd database to reclaim space and reduce bloat. The way to do this is by limiting the object count and etcd database size per cluster, based on vendor or upstream guidelines and continuous monitoring.
However, managing these tasks manually and relying on your architecture alone to ensure uptime isn’t a good idea. There are many other responsibilities involved in maintaining the overall health of the cluster, rather than focusing only on data store management, which most teams neglect to perform regularly on etcd before a disaster happens.
Even if the reliability teams focus on defragmentation or sharding approaches before disaster, they aren’t very effective, and overall performance remains unchanged due to the core etc design. The limitations lie in how physically sharding etcd is complex, unsupported, and risky.
The approach of dividing your etcd into multiple clusters, which many tenants recommend, involves replicating all data to each cluster member and managing it through a single, global log. This setup does not support horizontal scaling or sharding across multiple replication groups, making true linear scaling very difficult and complex to implement in practice. Additionally, because etcd does not support splitting a single logical keyspace across multiple clusters, it complicates durability, backup and restore, and linearizability guarantees when you try to work around etcd without support for upstream etcd sharding.
Furthermore, you gain no benefits when there are conflicting CRDs during operator development or application development.
While this approach helps with the conflicting CRD by reducing blast radius, there is still no linear global scaling. However, it introduces increased operational complexity, as maintaining, backing up, and recovering from issues across many clusters is more demanding. It also incurs higher costs for the control plane and operations due to the many tools involved.
All of this occurs without shared keyspace, meaning each cluster remains a separate atomic unit from an etcd perspective.
The solution to the performance problem is virtual clusters with vCluster. The open source multi-tenancy tool decouples tenants from a single api server and etcd by providing isolated virtual control planes per team, app, or environment. While vCluster technically introduces a form of sharding, it operates at the control plane level, not by splitting a single etcd instance, but by spinning up dedicated etcd instances per tenant. This avoids the risks of low-level sharding and provides safe, scalable isolation.
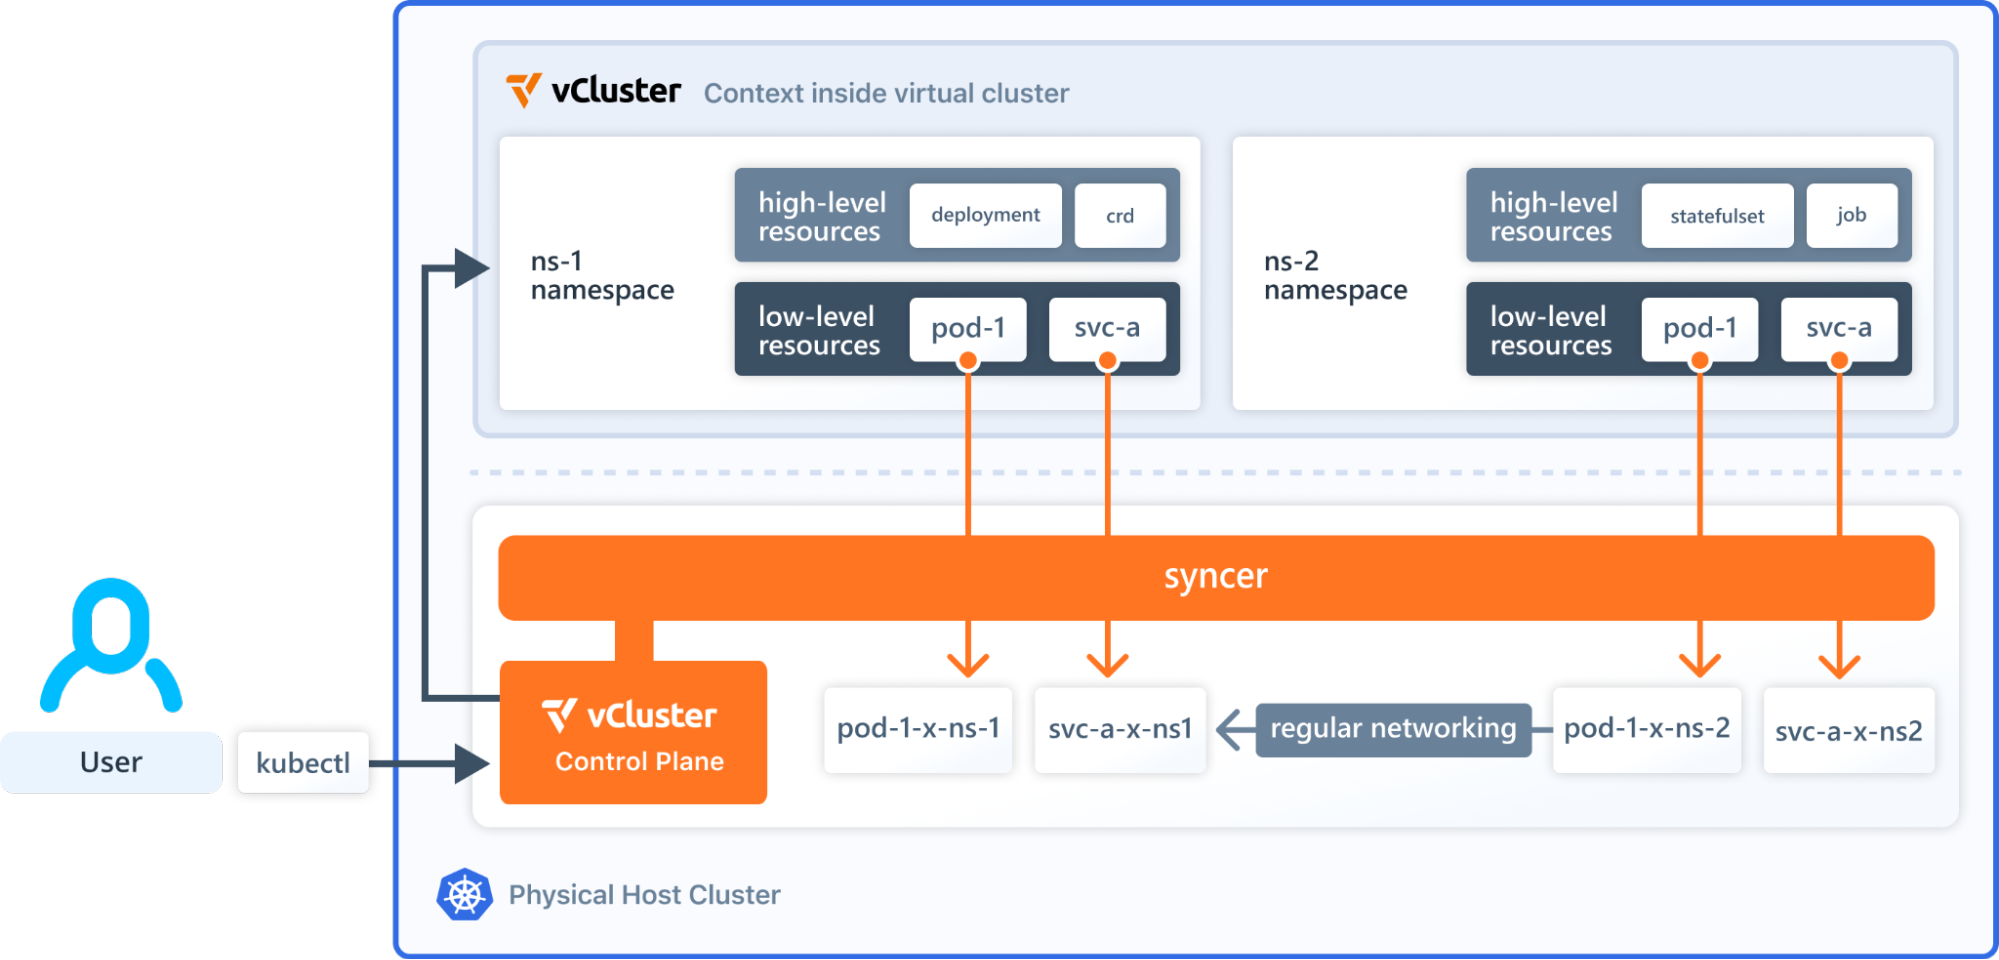
This virtualization of control plane approach removes the ceiling of single-cluster growth, etcd limitations, and the 'Noisy Neighbor' effects for CRDs, as now object count is scoped to the vCluster, not the host. As your api requests now go through the virtualized control plane, there’s no load on the host tenants while maintaining the shared infrastructure (compute, storage, networking), so you still get consolidation and efficiency.
The first step to optimize load is to generate some load and measure it. Generally, any object creation overwhelms etcd, but objects like Pods require compute and memory. For this demo, we will focus on objects that don’t require compute and memory, like Secrets, for simplicity.
For prerequisites, there are only a few:
- Have a Kubernetes Cluster
- Have Helm and kubectl installed
For monitoring, the recommended approach is to set up kube-prometheus-stack, which includes:
- prometheus-community/kube-state-metrics
- prometheus-community/prometheus-node-exporter
These together will help you measure the load when it’s generated. To install the stack, use the following Helm command:
helm repo add prometheus-community https://prometheus-community.github.io/helm-charts
helm repo update
helm install kube-prometheus prometheus-community/kube-prometheus-stack --namespace monitoring --create-namespace
To access the Grafana dashboard, use the following command to patch the service to NodePort. Installation instructions will include your username and password, which you can use to access the UI:
kubectl patch service kube-prometheus-grafana -n monitoring -p '{"spec":{"type":"NodePort"}}'
Now, with your Grafana dashboard ready and Prometheus configured as the default data source. The prepared dashboard (Import Here) queries a few key Prometheus expressions (expr) in each panel. The dashboard has been limited to secrets object for simplicity, but you can measure more for a thorough observation:
The next step is to feed the metrics. You do this using the script:
#!/bin/bash

NAMESPACE="etcd-stress"
COUNT=1000
SLEEP_INTERVAL=1

# Create namespace if it doesn't exist
kubectl get ns $NAMESPACE >/dev/null 2>&1 || kubectl create ns $NAMESPACE

echo "Creating $COUNT secrets in namespace $NAMESPACE..."

# Create secrets
for i in $(seq 1 $COUNT); do
  SECRET_NAME="stress-secret-$i"
  echo -n "data-$i" | base64 > /tmp/data.txt

  kubectl create secret generic $SECRET_NAME \
    --from-literal=data="initial-value-$i" \
    -n $NAMESPACE --dry-run=client -o yaml | kubectl apply -f -

  if (( $i % 1000 == 0 )); then
    echo "$i secrets created..."
  fi
done

echo "Initial secret creation complete."
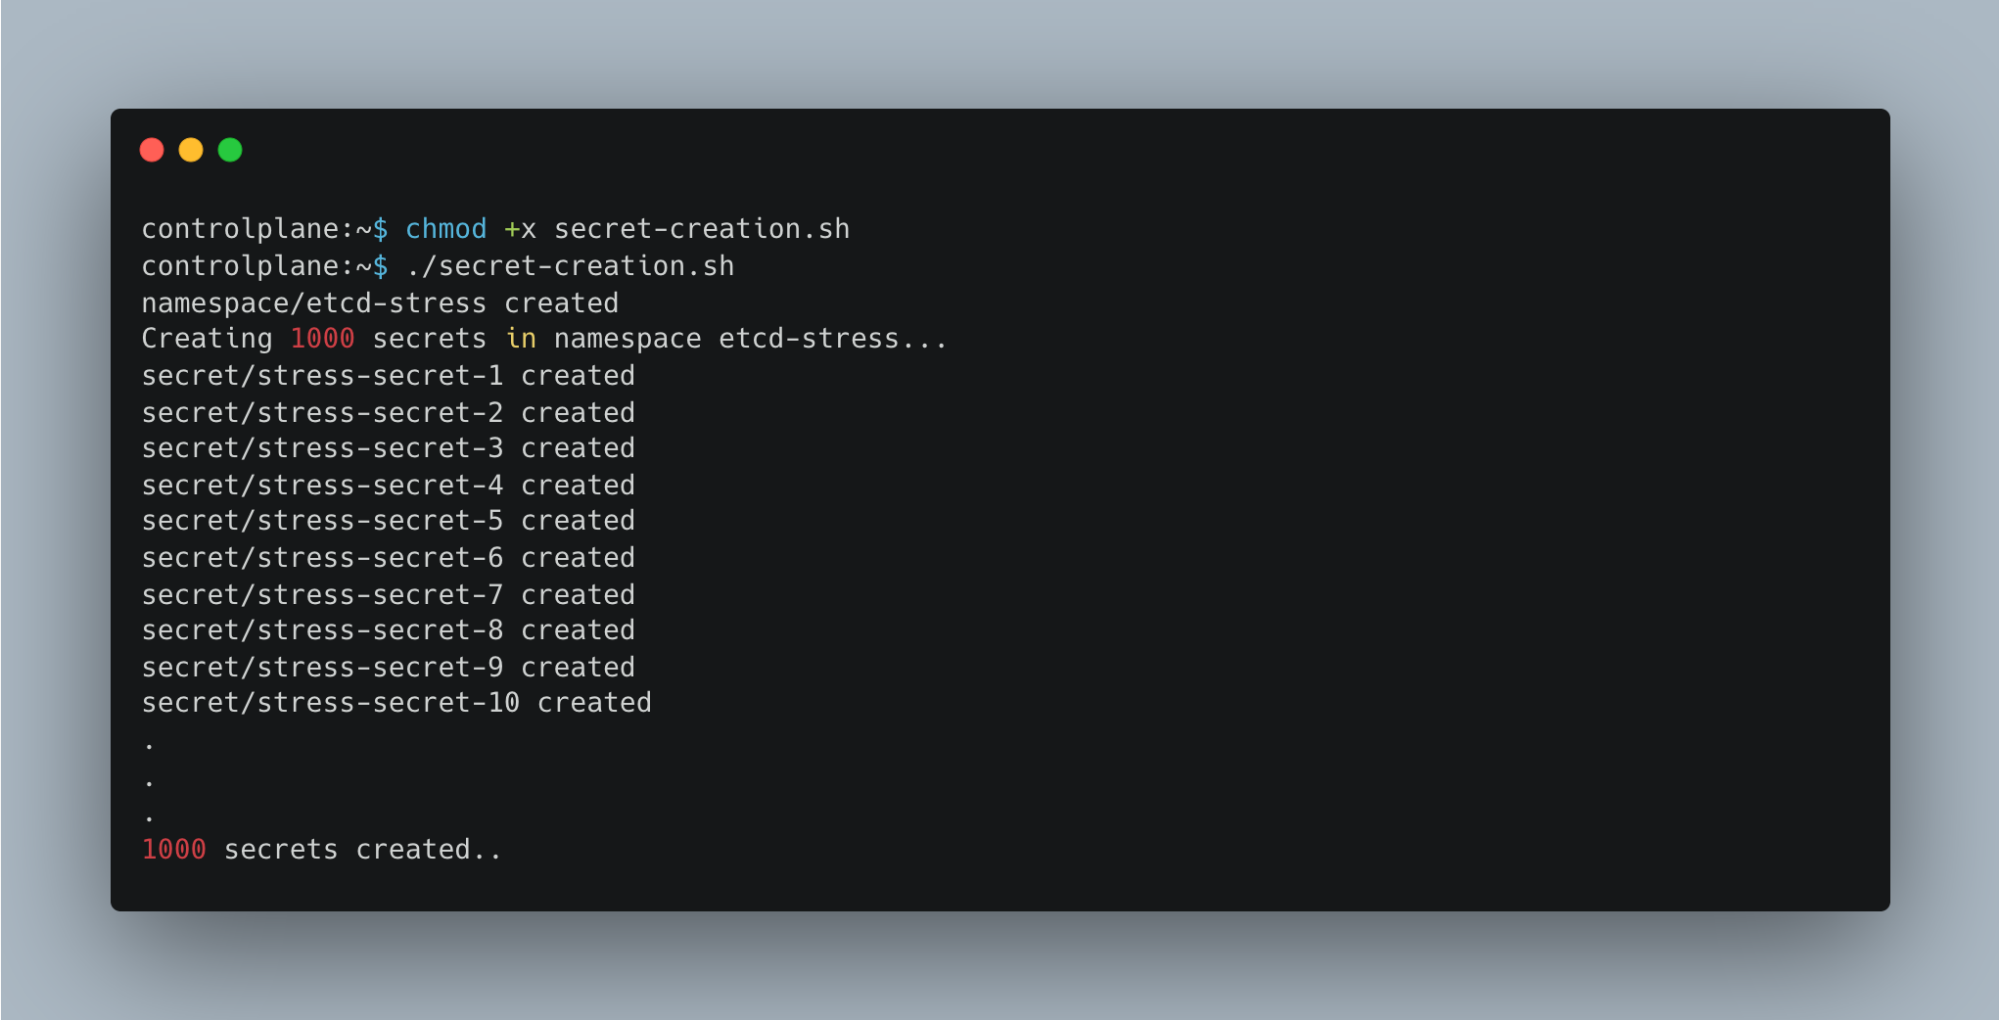
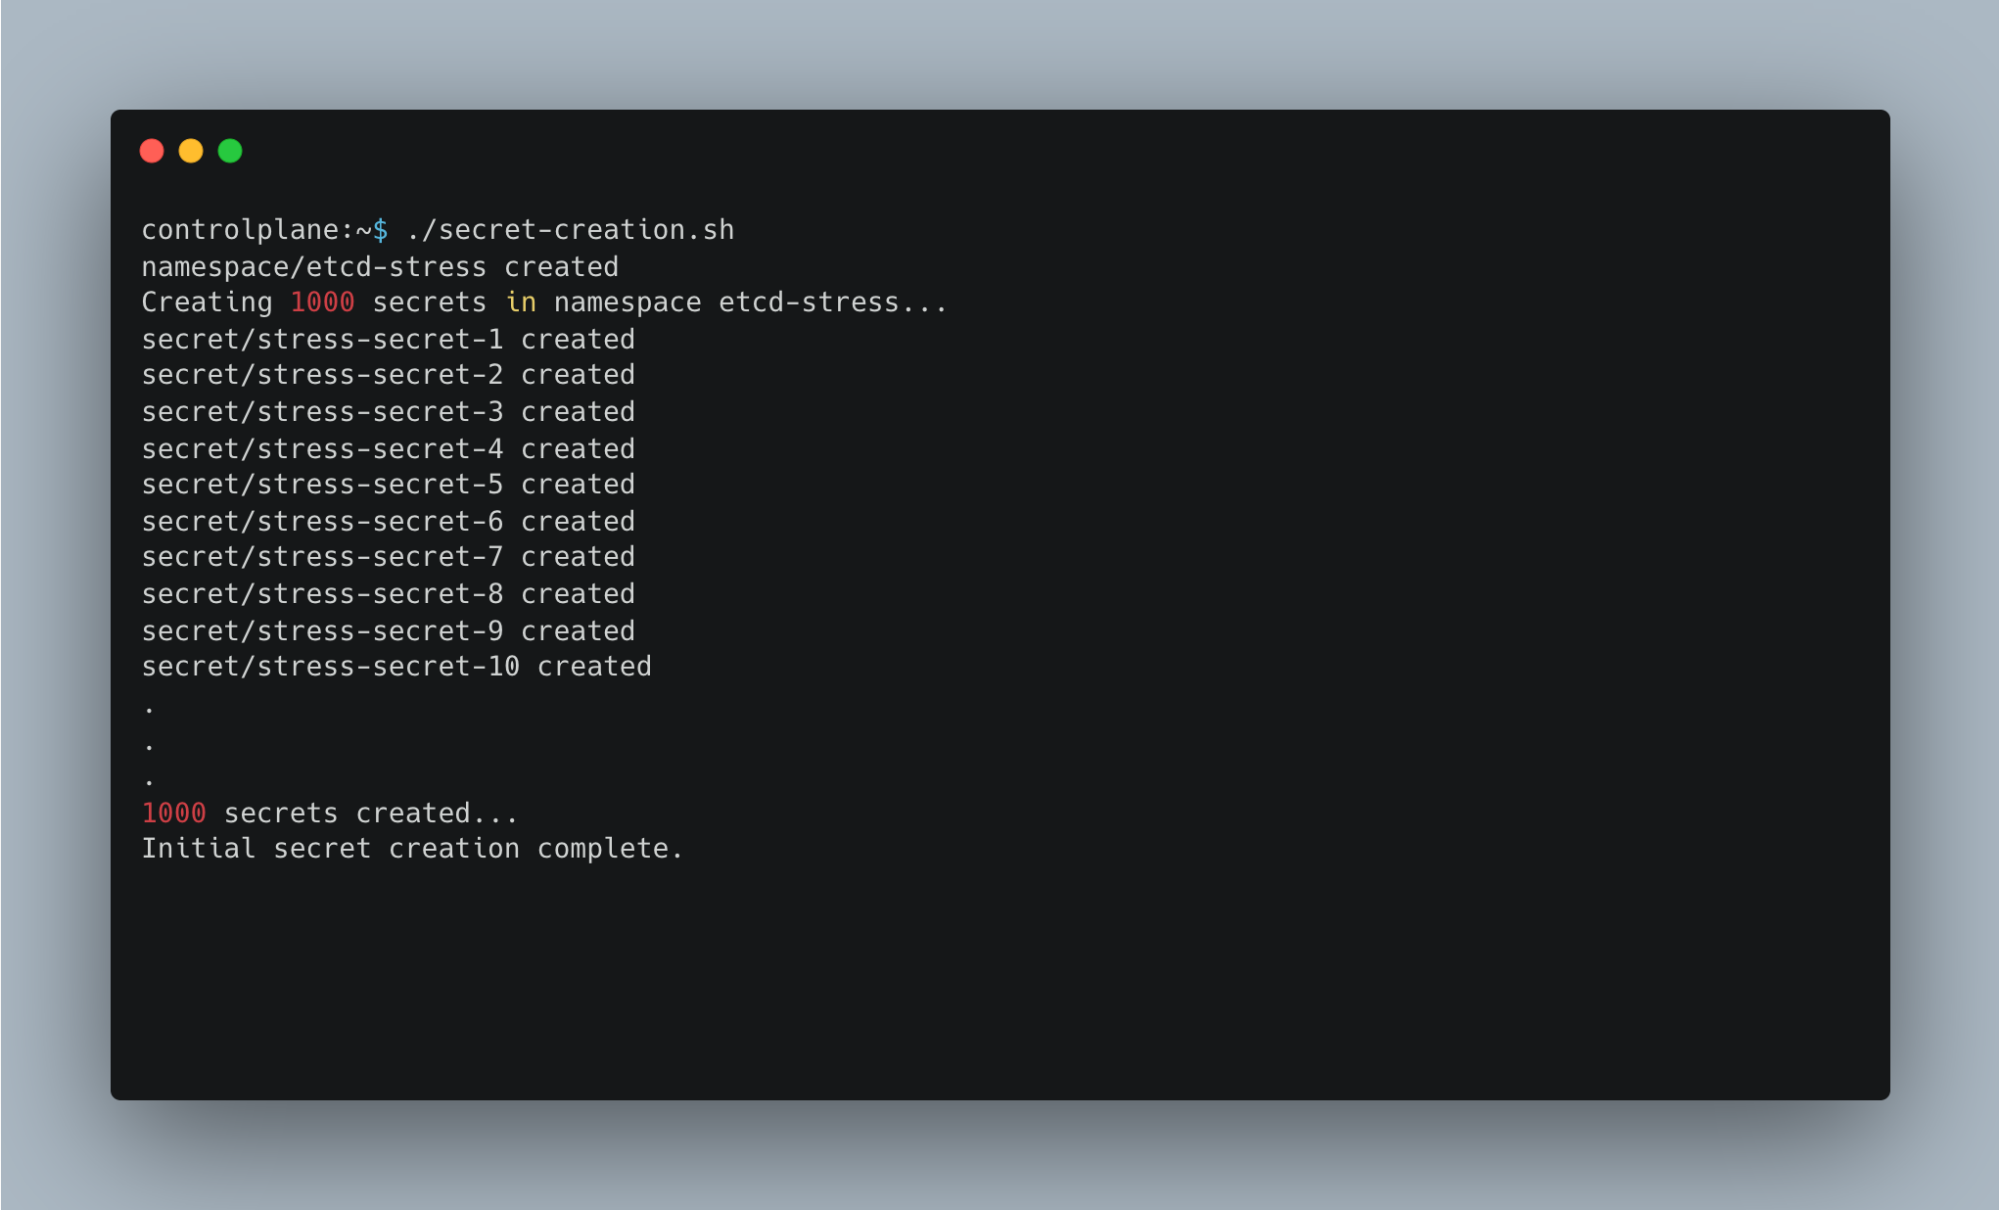
Run the command below, and you'll see a lot of secrets (1000) being created.
Now, as the secret creation scales, you will notice an increase in the load on the API server, latency, and the total number of requests:
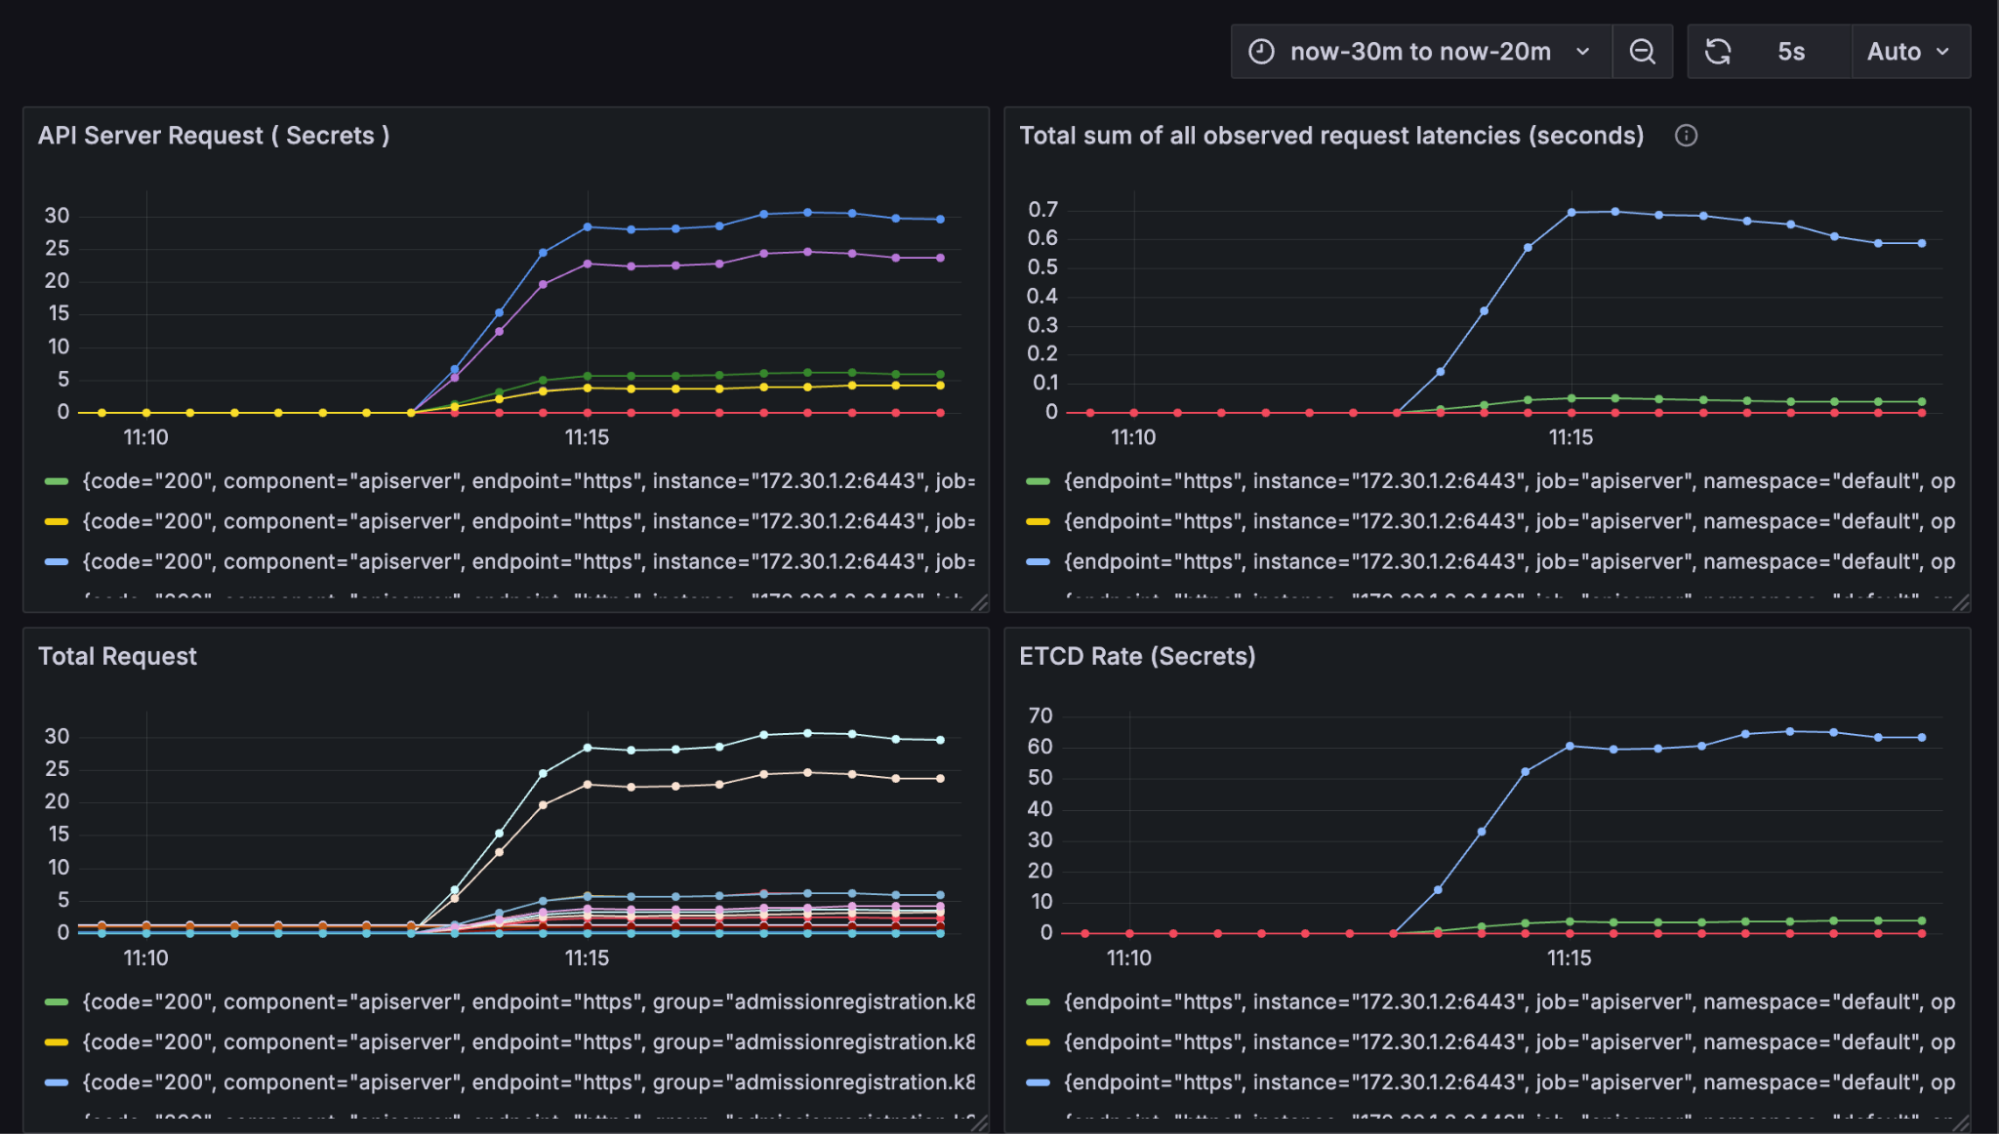
The total number of requests increases as new objects are created. With just a thousand object creations, the impact on etcd results in a latency increase of 0.5 seconds while creating more load on the api-server.
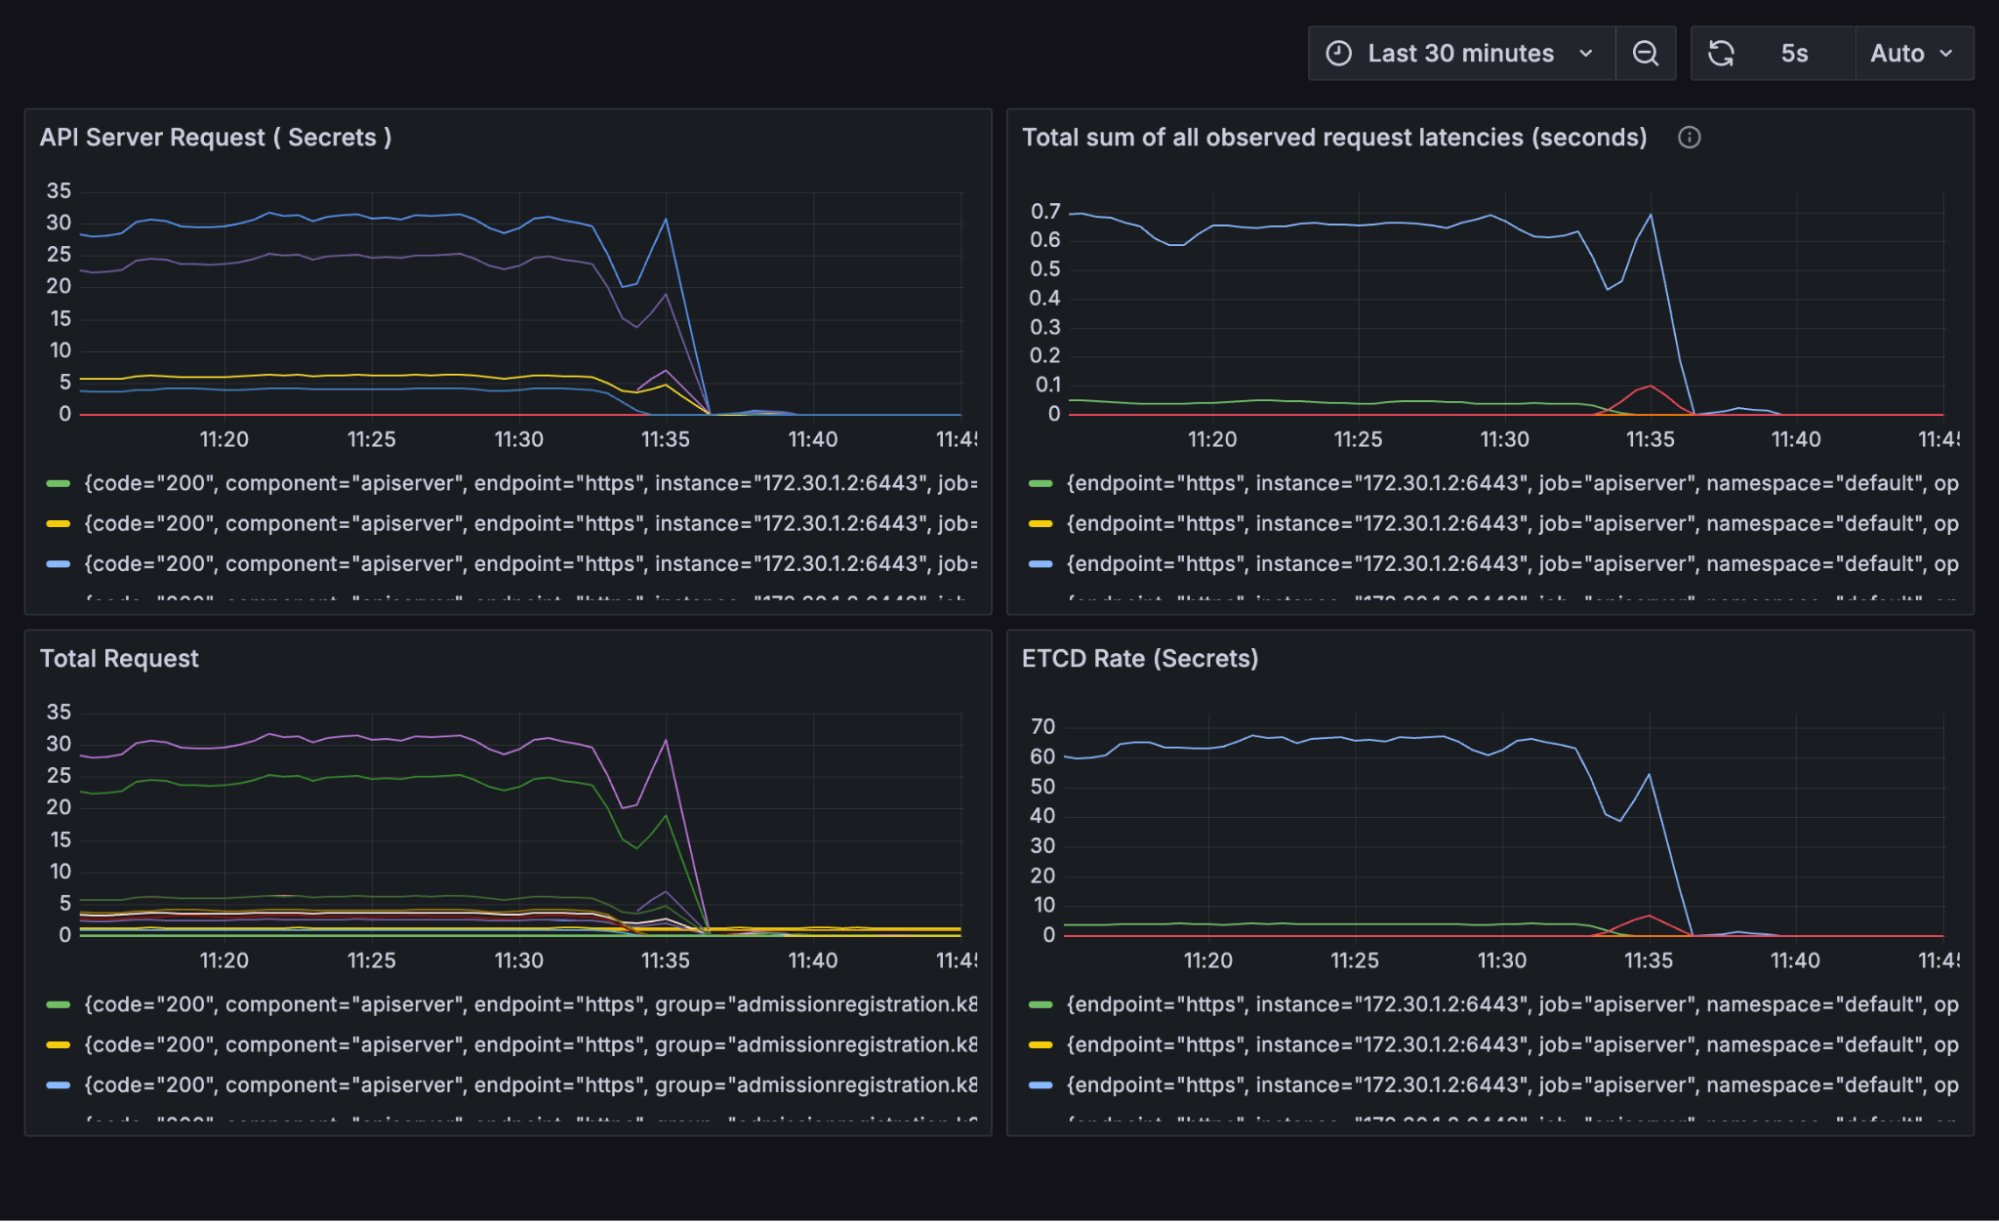
The entire rate graph illustrating the operation from 0 to 1000 secrets is depicted as follows, providing a detailed overview of the progression and variations throughout the process:
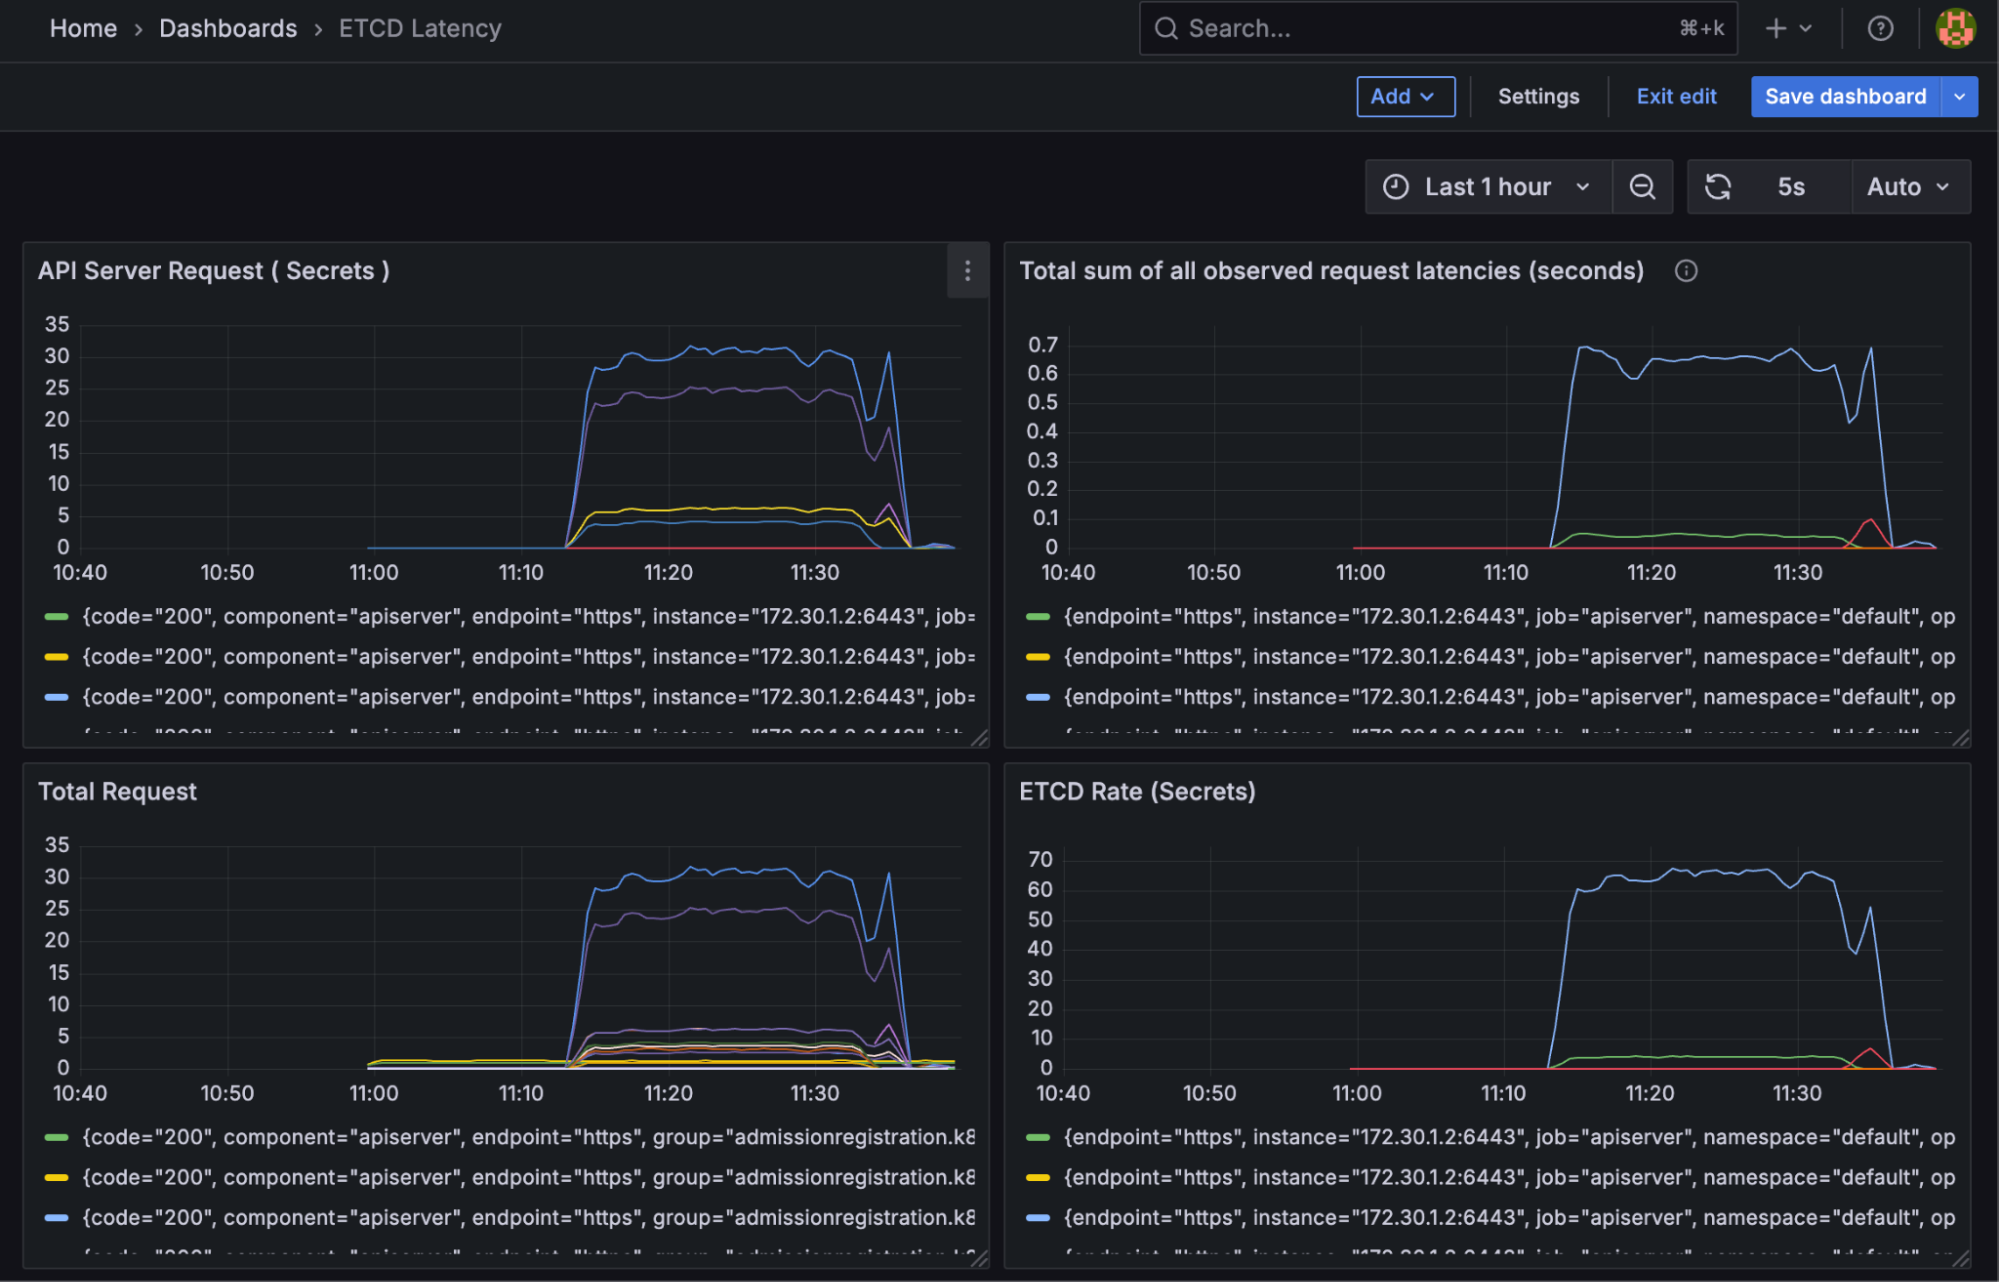
As the operation ends, the latency and request drop back to the normal range of 0-5 from the elevated 25-35 (6X lower). However, for teams using a shared cluster, this might not be the case. With thousands of objects constantly being modified and created by different teams, latency could become very high, and API operations could be compromised, halting the entire cluster. Here comes the need for virtual clusters to remove the load from the host cluster to the virtualized control plane.
Since teams can have their own dedicated control plane to manage requests and the data store, you won't overload your central host cluster. The steps are simple, and you just install vCluster using the following command without dealing with many moving parts, which is usually the case with other cluster creation tools:
curl -L -o vcluster "https://github.com/loft-sh/vcluster/releases/latest/download/vcluster-linux-amd64" && sudo install -c -m 0755 vcluster /usr/local/bin && rm -f vcluster
Once the CLI is installed now you can create your first virtual cluster with the simple command:
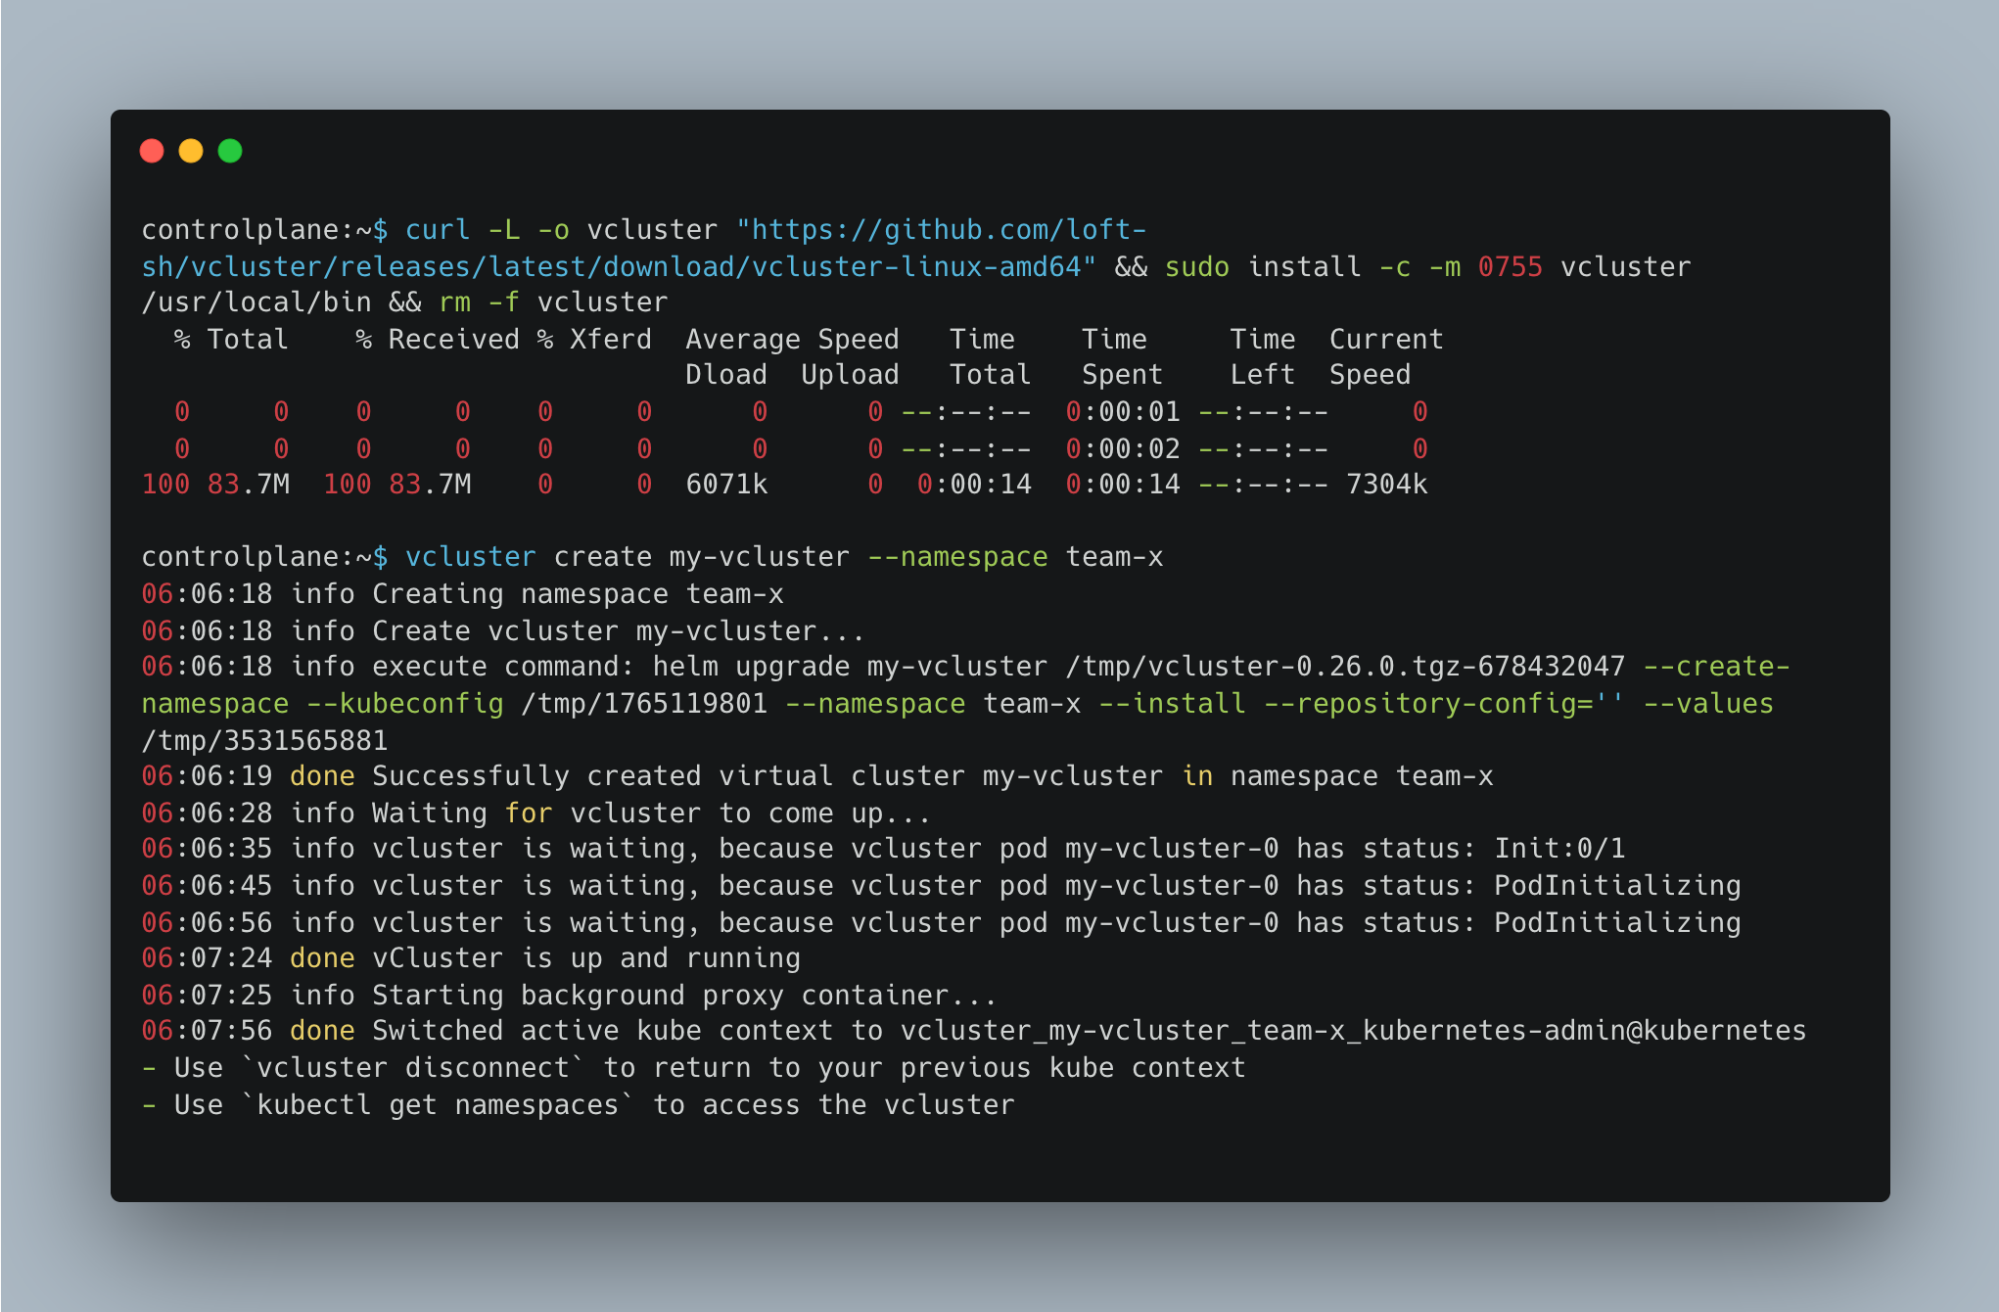
vcluster create my-vcluster --namespace team-x
The operation creates a virtual cluster on your host and switches the context to it so you can use it for your tasks. A successful deployment should look similar to the example below:
Now we would do the same secret creation operations, as we did in the host cluster. Pull in the same manifest and run the script:
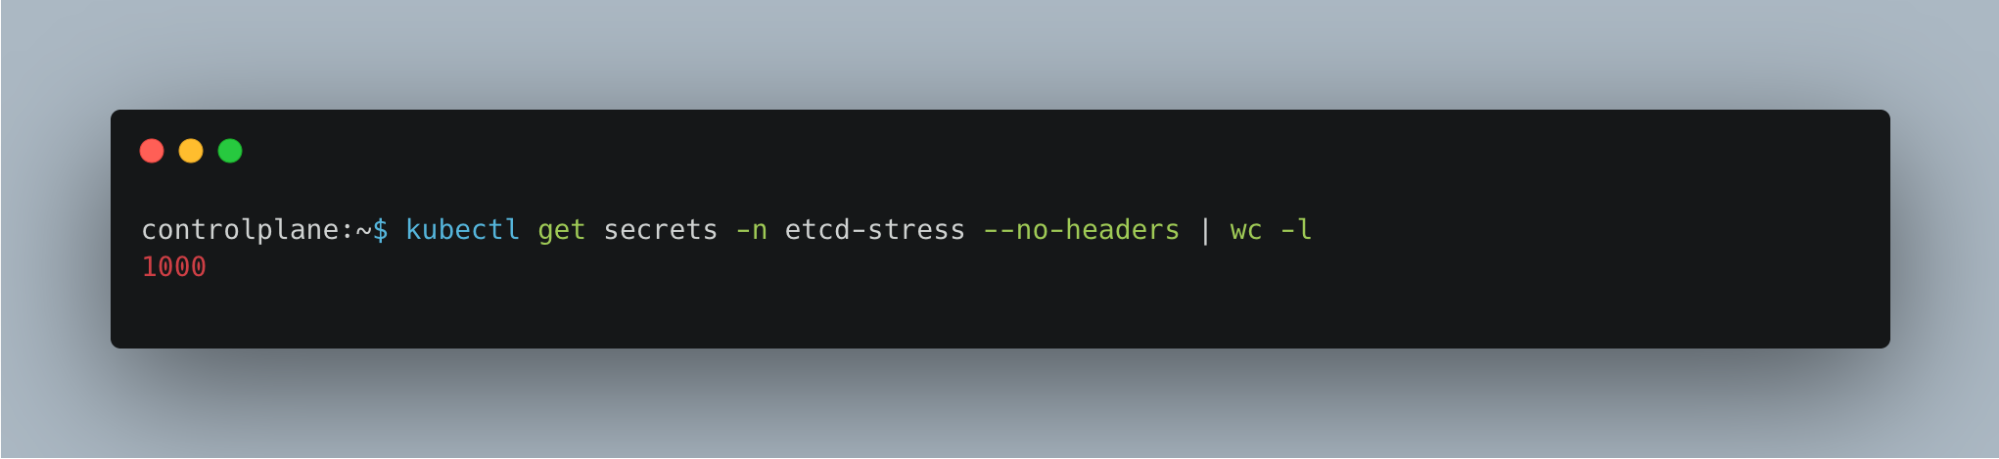
With the script completed, you can see there are a thousand secrets:
However, what does the Grafana dashboard say?
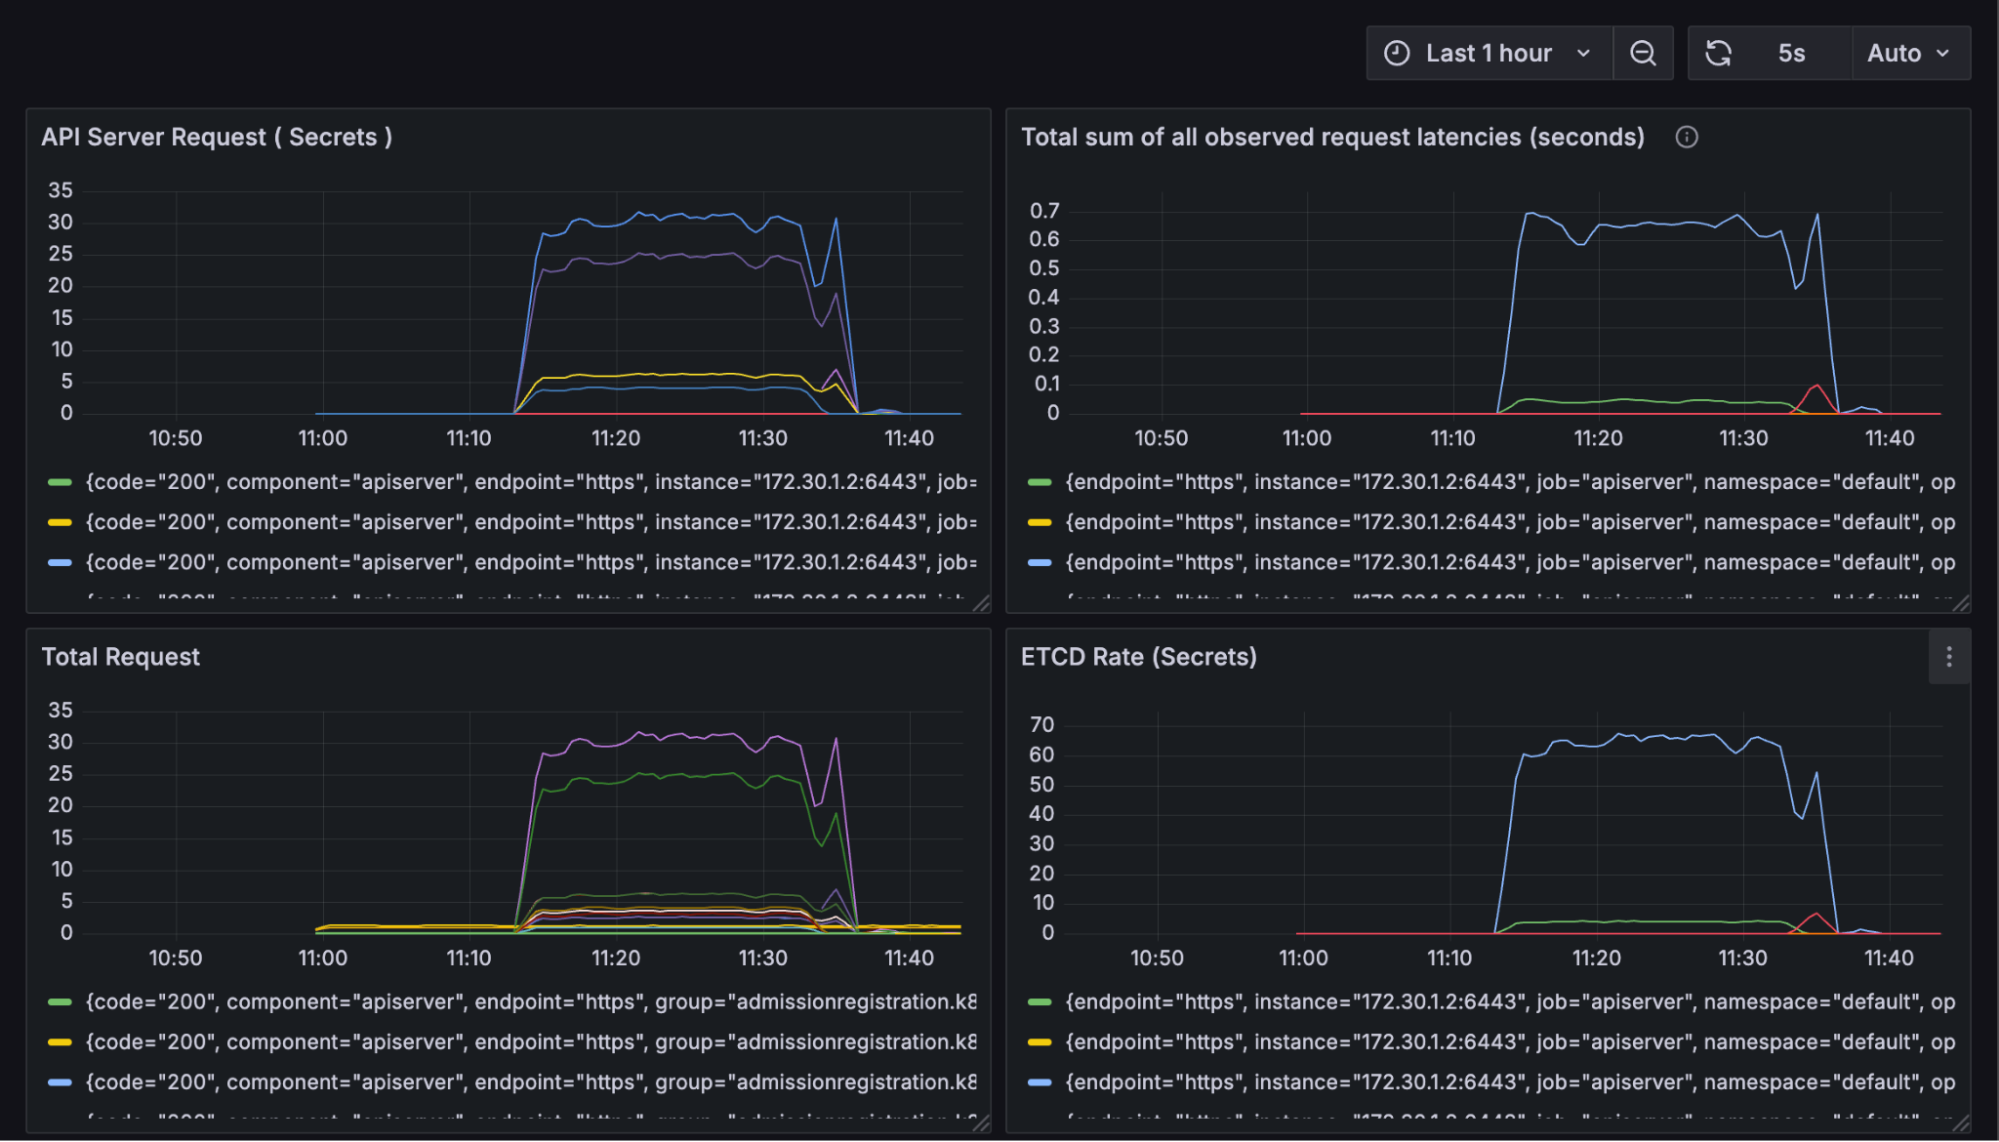
During the load test where 1000 Secrets were created, etcd latency on the host cluster spiked to approximately 650ms. This clearly demonstrates how even lightweight object churn can stress the Kubernetes API server and etcd.
In contrast, when the same test was conducted inside a vCluster, no spike appeared on the host’s metrics (load or latency). All etcd operations were managed by the vCluster’s isolated control plane and data store. This indicates that the host etcd and API server remained completely unaffected, allowing for safe multi-tenancy and uninterrupted performance.
If we want to investigate our new vCluster Pod, it will give us some insights. We do this by measuring the CPU usage of our virtual control plane pod:

As you can see, it consumes some CPU while loading to create the required resources, then returns to normal. Now, as secrets are being created, the CPU usage increases without impacting the host. The total request graph for the api-server says the same story:
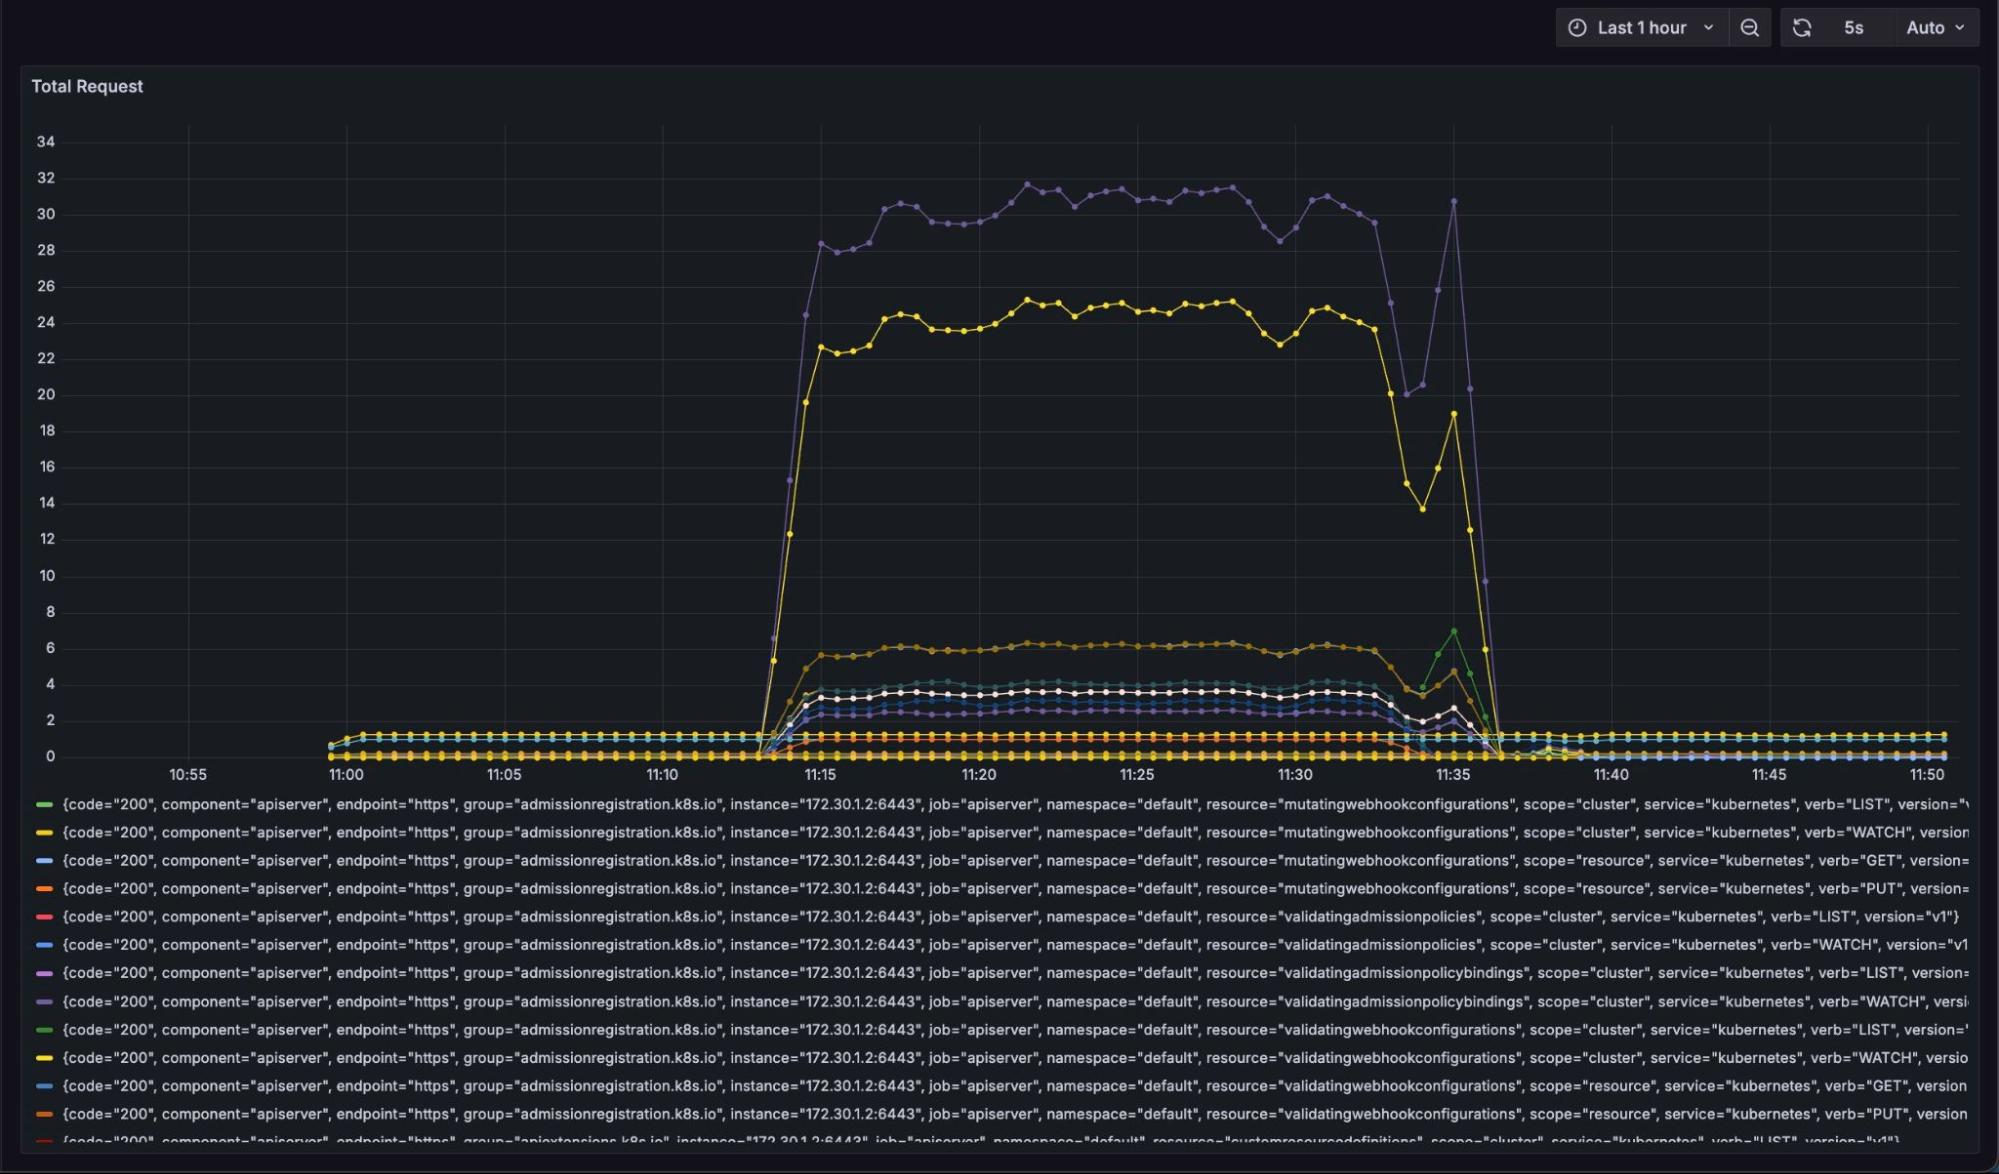
Now, if we look at the work queue latency, which measures how long a task waits in a queue before being processed, the diagram speaks an overall picture of the cluster:
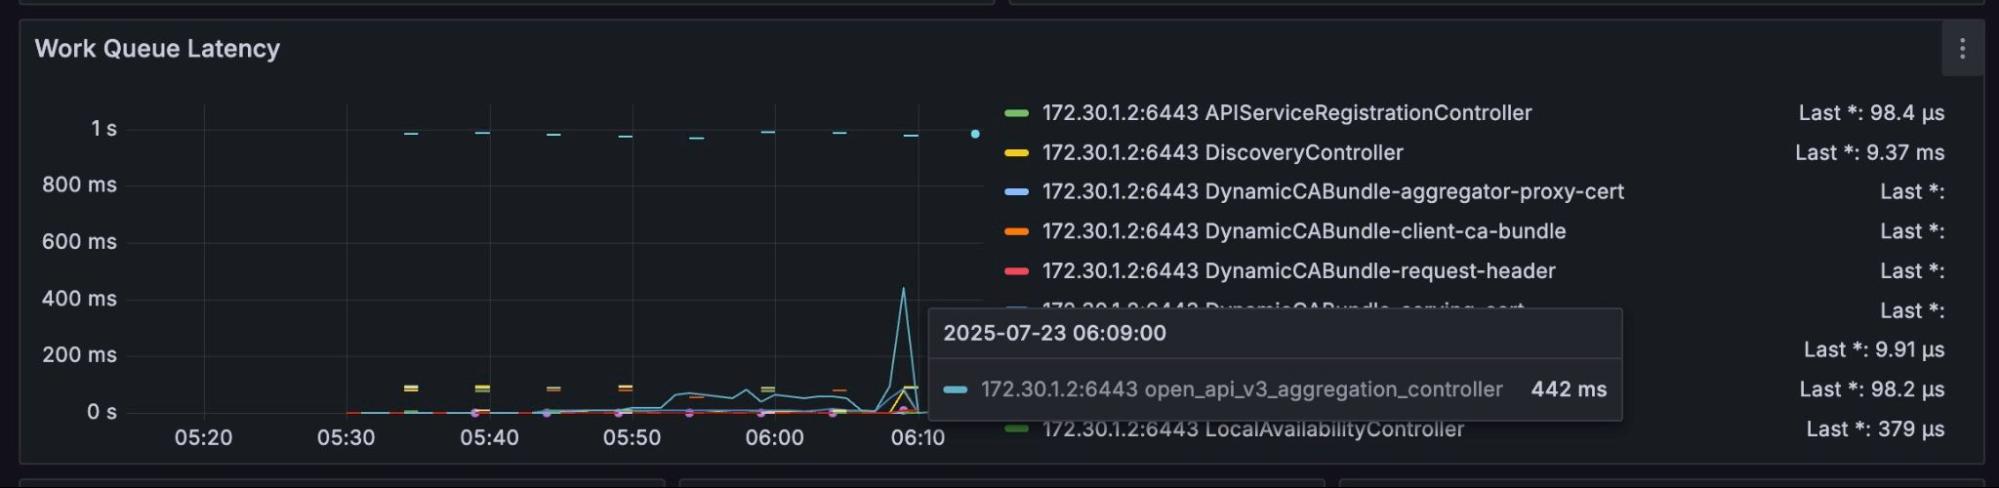
As you go through the data, you'll notice a significant increase in latency when secret creation operations are performed in the host. However, the work queue latency issue is also mitigated with a virtual cluster, as there’s no more load spike on your host cluster when you virtualize using vCluster.
As you saw, vCluster eliminates all the performance bottlenecks from your single etcd and API server on the host, providing a fast and efficient architecture that scales with your team. To reiterate, here are these awesome benefits:
The way vCluster is architected enables rapid cluster spin-up, reducing wait times for teams since normal cluster creation takes significantly longer. You can easily share access to individual isolated instances, and as vCluster shards the control plane, not just the etcd datastore, it eliminates common performance bottlenecks of API servers while offering the benefits of having a separate etc.
vCluster maintains shared compute, storage, and networking resources, allowing for improved efficiency. This reduces the number of physical clusters (e.g., from 10 at 70% utilization to 7), as there’s no need to duplicate platform components like ingress controllers, cert managers, and others for your virtual clusters if you want to reuse them.
The same applies for CRDs as there’s an option to sync CRDs in-built. This overall simplifies platform management by allowing CRDs from the host to be shared with virtual clusters or vice versa, enhancing compliance and manageability for platform teams.
Backup is important, but the high resource usage and slow restore times associated with etcd snapshotting can often be challenging. Restoration time for follower nodes can be quite high and may experience slower recovery, and the leader node might struggle to keep up with the demands of snapshot generation and transmission when you restore your cluster from an etcd backup.
vCluster has a built-in snapshot and restore feature that enables seamless cluster backup and migration. This enables faster disaster recovery and allows you to shift your clusters to different infrastructure when needed, such as during migrations.
Traditionally, you back up both the data store and configuration of the cluster separately, but with vCluster, it’s automated and includes much more, making it simpler than restoring the etcd and the cluster separately.
Because the control plane is sharded, each vCluster has its own dedicated resources. Actions like over-creating resources, deploying large numbers of objects, or exploiting APIs via brute-force are isolated to that specific vCluster instance. This isolation holds whether issues arise from a misconfiguration, automation gone wrong, or a malicious attack.
As a result, platform teams can be more confident in the system's resilience: even in cases of severe misbehavior or malicious actions within a vCluster, the overall health of the platform remains protected. This is in contrast to namespace isolation, where abuse might exhaust shared API server and etcd resources.
etcd is a critical component for cluster management, but its limitations can put your entire cluster state at risk. Any team that’s scaling should consider these challenges to become more resilient.
vCluster offers a scalable and safer alternative, supporting thousands of workloads and tens of thousands of objects without running into upper limits. This architecture enables safer multi-tenancy both for CPU and GPU and ensures more predictable cluster performance.
For teams experiencing etcd constraints or planning for future growth, it's time to consider a new approach and read more in the docs. Join the vCluster Slack community to learn more, ask questions, and connect with others optimizing for large-scale, reliable Kubernetes operations.
Deploy your first virtual cluster today.
